
During the discovery process with a new client, we learned that 2 months prior, their site had a technical issue that caused many visitors to leave upon arriving on the homepage. We could clearly see that from their analytics based on the elevated homepage bounce rate during that time period. It turns out that it was a relatively easy fix, but what was really unfortunate was that the client did not become aware of the problem for almost a week and lost measurable sales as a result of not being quickly alerted to the problem.
Conversion rate optimization (CRO) requires that all facets of the visit experience are optimal. When you think about all the things that can go wrong in driving traffic to your site, engaging and converting that traffic, it really makes sense to have a tool that can watch over your key metrics and alert you when there’s a potential problem. The good news is that a tool does exist, which is free and easy to setup. Called Custom Alerts, it’s available in all Google Analytics accounts.
Custom Alert Features
The key to best using this tool is to identify the important metrics that drive your business and determine threshold levels for each metric that could signal a potential problem. For example, let’s say your conversion rate typically varies between 2 and 3 percent, only rarely dipping below that 2% level on any given day. You’d probably want to know, then, if your conversion rate falls under that threshold so you could begin researching the reasons and fixing the problem responsible for the unusual decline.
As you identify metrics and thresholds, you’ll also want to think a bit deeper into whether any of these alerts should be tied to a specific source/medium, new vs. returning visitor, specific page, geographical location, device type or another dimension. Google Analytics allows you to create alerts by various dimensions.
Yet another useful option is to set the alert to only fire when a key metric increases or decreases a certain percentage from the previous day, week or year. And finally, you can create a new annotation in your Google Analytics account to show when you created the alert.
Let’s see how easy this is to setup
Step 1: Since custom alerts are tied to the Google Analytics view where they’re created, we recommend you be in the appropriate view that’s tied to your account.
By clicking on “Customization” in the upper left, you’ll see an expanded list that includes “Custom Alerts”.
When you click on “Custom Alerts”, your screen will look like:
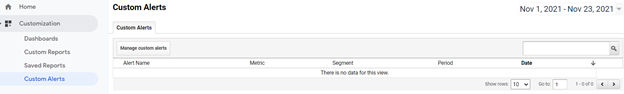
Then click on the “Manage custom alerts” button.
Step 2: Next, you’ll want to create your new alert by clicking on the “+ NEW ALERT” button.
Upon clicking that button, you’ll be prompted to name your alert and select which view(s) to apply this alert to. You can also select either day, week or monthly period for the alert to monitor and check. Usually selecting day works best for more immediate feedback, but week or month may be best for you if you’re monitoring a metric that has a low data sample size and may experience large swings on a day-to-day basis. Be sure to click the “Send me an email when this alert triggers” checkbox. This will allow you to add multiple email addresses if you have other people in your organization that should receive the email alerts.
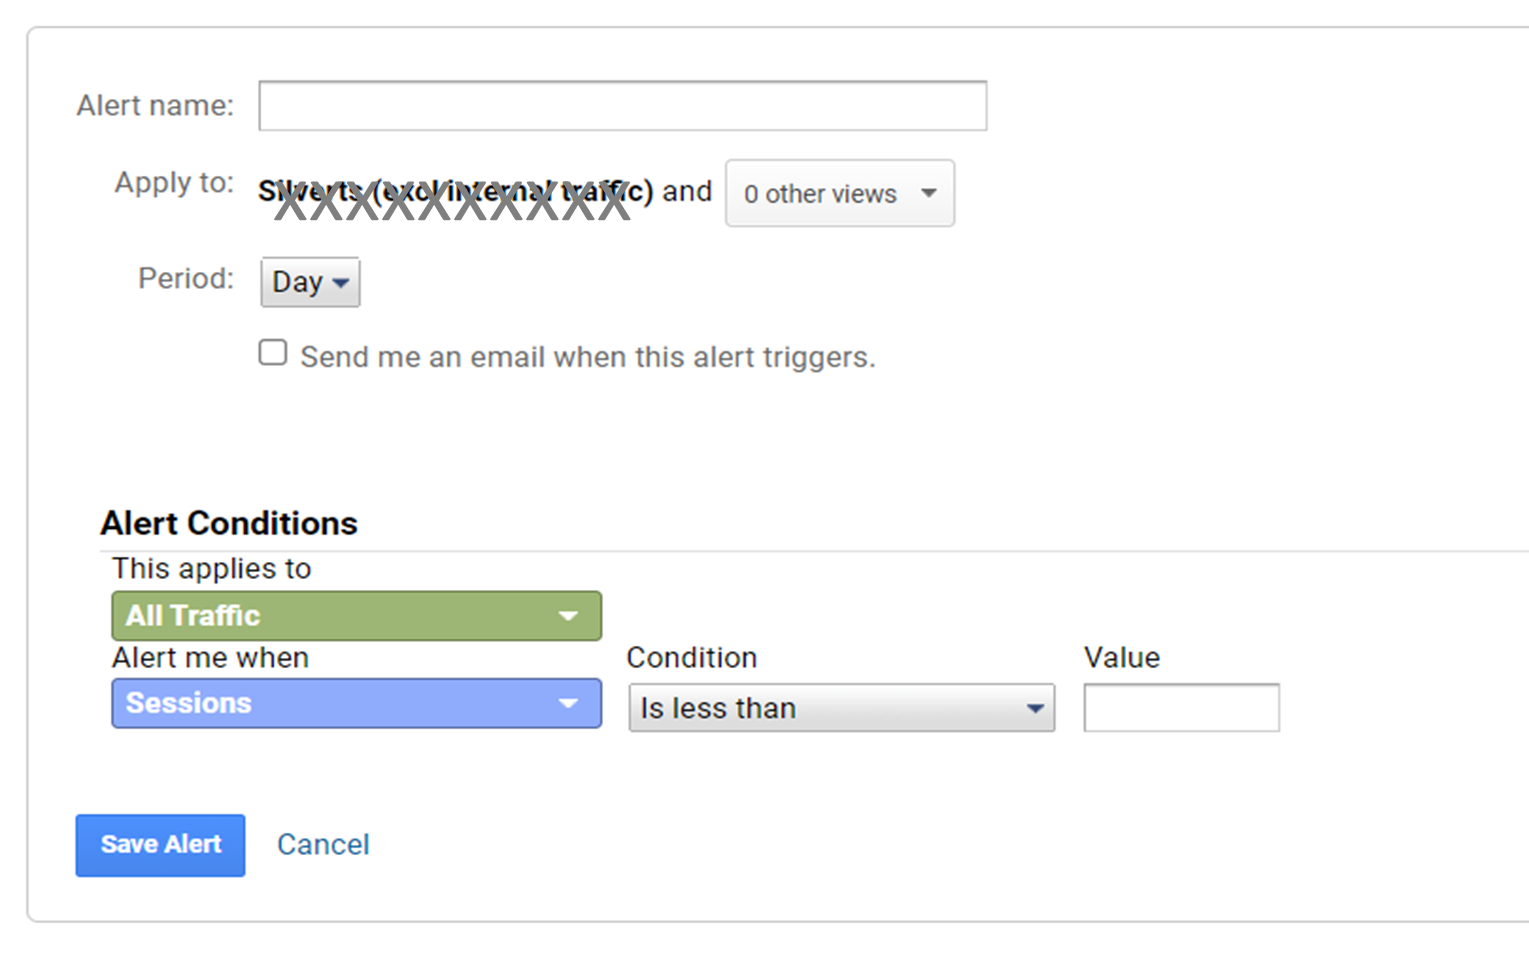
Finally, in the “Alert Conditions” section, you can specify the conditions when the alert should be triggered.
Helpful examples to help you get started
Here are a few typical alerts we’ve found helpful with our clients:
- Unusual drop in number of sessions or users (note that you can set this up for each of your main traffic sources for increased visibility into where the drop off occurred) which could indicate issues with traffic sources
- Unusual increase in bounce rate for a specified page(s) which could indicate problems with the page
- Change in page load times, similar to bounce rate monitoring, could be an indication of a technical problem with a page
- Unusual drop in number of events, or goal or eCommerce conversion rate can alert you to any potential issues with funnels and sign-up flows and forms
- Abnormal increase in exit rate for a specified page may indicate a problem with either page loading or content on the page
- Significant drop in purchase activity for a specific SKU which could indicate potential issues on that product’s detail page or inventory levels
If you are interested in learning more about Google Analytics and you can benefit from it, contact us today!